A Home for the Biodiversity Stripes

The biodiversity stripes have been so popular they now have their own home at biodiversitystripes.info which aims to raise awareness of the loss of wildlife. The new site also provides some new stripes based on UK data for priority species, moths and farmland birds. Measuring and indicating biodiversity is very complex, which can make telling a simple story about the loss of wildlife difficult, but there is an urgent need to make the problem visible. People need to be aware for change to happen.

biodiversitystripes.info – a dedicated home for the biodiversity stripes

In other recent news, the stripes have been adopted by the Nature Positive campaign led by Nature4Climate. A global effort to raise the profile of action to protect, manage and restore natural ecosystems for the benefit of the world’s peoples, the climate and biodiversity. They also appeared at the COP27 Nature Zone, part of the backdrop to many events. Alongside the climate warming stripes, the biodiversity stripes decorated a baton to be taken to COP15 to unite the climate and nature agenda.

Some might wonder why biodiversity matters and about the link to nature connectedness. Biodiversity is the variety of life on Earth. It supports life and is fundamental in providing the air we breathe and food we eat. Humans evolved within a vibrant, biodiverse, natural world. It is inherently good and vital for our wellbeing. Yet through a disconnected relationship dominated by use and control of nature we have done great damage to the natural world. A spiralling breakdown as when biodiversity decreases so does our relationship with nature. A failing relationship that the UN recognise as the root cause of the environmental crises. Which is why our wider research explores ways to fix the failing relationship with nature.


Posted in Uncategorized | Leave a comment

Biodiversity Stripes Update

Please note, the biodiversity stripes have been updated and now have a dedicated site at https://biodiversitystripes.info/  

The biodiversity stripes I shared in the summer have been very popular. This follow-up post shares some more news on their use and a revised set of stripes – updated data in the latest Living Planet Report means two more grey stripes had to be added, as our green natural world turns increasingly grey.

First the updated stripes. The biodiversity stripes are based on the Living Planet Index which tells us that the population of mammals, birds, fish, amphibians and reptiles has now seen an average drop of 69% globally since 1970. George Simons has suppored the bio-stripes by creating hi-res versions of the global stgripes suitable for print – if you are interested get in touch).

Global Bio Stripes 1970 to 2018 – Data: Living Planet Index http://stats.livingplanetindex.org/

Once again I’ve also simply overlaid a declining flock of birds onto the global bio stripes – please get in touch if you’d like to create some compelling overlays.

Global Bio Stripes 1970 to 2018 with birds – Data: Living Planet Index http://stats.livingplanetindex.org/

And now the news. Last week the stripes were used to open an official seminar by Scientist Philippe Grandcolas from the French National Centre for Scientific Research (CNRS) on climate change and biodiversity loss with French MPs in the French National Assembly.

This follows a makeover of my biodiversity stripes toucan, which is available on a variety of Greenpeace tops – an excellent and worthwhile Christmas gift i’m sure!

(Greenpeace/Teemill)


————————————

George Simons recently founded Ruleo with the mission of using technology as a gateway to nature, to make it accessible, engaging and fun for all children to grow, play and learn with the natural environment. The desired outcomes are to improve children’s health, wellbeing and inspire environmentally friendly behaviours. Their current focus is developing an immersive app that connects children with nature through play and learning. They are collaborating with experts, organisations and charities that support learning in nature, outdoor play and nature connectedness for children and families, and are growing new relationships to establish content development partnerships. Ruleo’s priority is to unearth new investment opportunities to enable the next phase of app development. Please email George to find out more or discuss partnership opportunities – george@ruleo.uk

————————————


LPI 2022. Living Planet Index http://stats.livingplanetindex.org/. Downloaded 8 August 2022

Use of the biodiversity or nature stripes work must include appropriate acknowledgement of Miles Richardson and, when based on their data, LPI (LPI’s preferred format: LPI 2022. Living Planet Index database. 2022 www.livingplanetindex.org). Note that products derived from LPI data for financial gain are prohibited without written permission of ZSL and WWF.
Posted in Uncategorized | Leave a comment

How to improve nature connectedness: A meta-analysis

There is global recognition from organisations such as the UN of the need to restore our broken relationship with nature. The science of nature connectedness captures that relationship and allows research to identify ways to improve it. With clear links between an individual’s nature connectedness, their psychological wellbeing, and engagement in nature-friendly behaviours, improving nature connectedness can help unite human and planetary wellbeing. Our latest paper, published recently in Sustainability, brings together previous research in a meta-analytic review to explore the impact of experimental manipulations and field interventions to improve nature connectedness in adult populations.

This blog summarises the full paper with sections on:

  • A Summary of the Types of Study
  • Results
  • Recommendations for practice
  • Recommendations for research
  • Conclusions

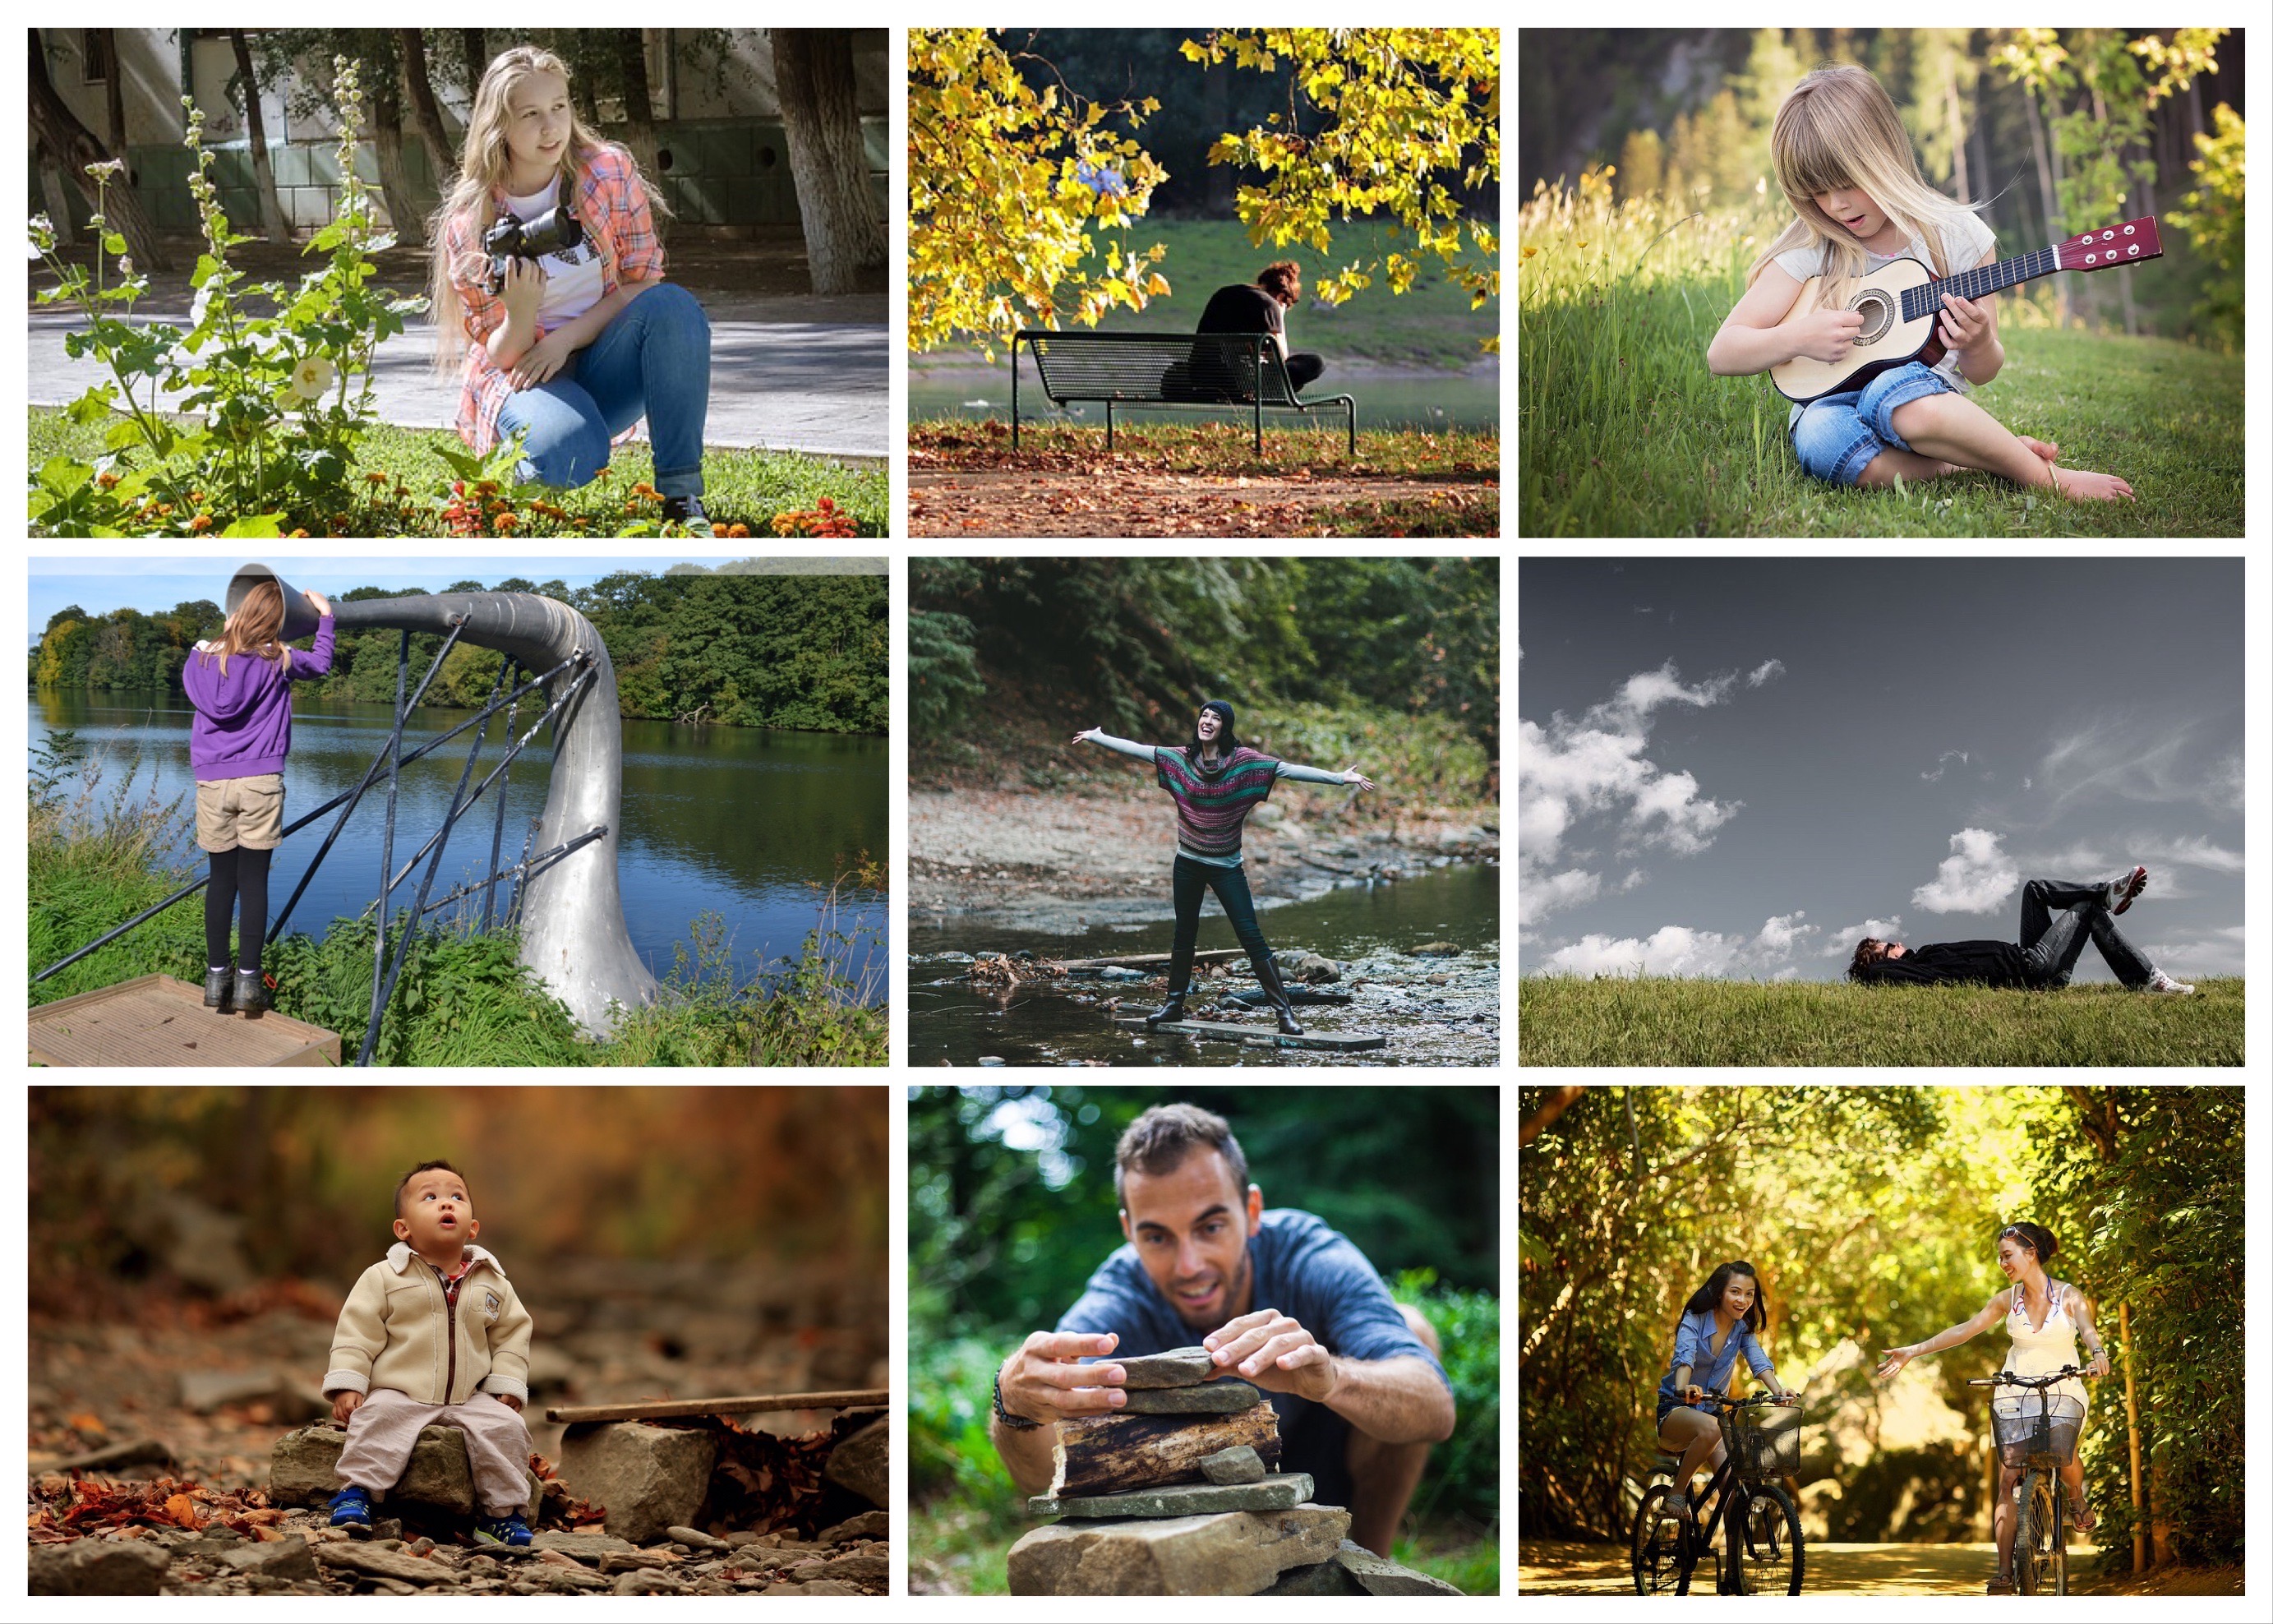
There are a variety of approaches to improving nature connectedness – what works?

A Summary of the Types of Study

The process of gathering all these studies showed a variety of approaches have been trialled. So, the analysis examined the relative effects of type of contact with nature (direct or indirect), quality of engagement (active or passive) and the timing of the engagement (single session, repeated practice or residential). Here’s a description and details of those four approaches:

  • Type of Contact – 27 studies with 3242 people involved direct contact with nature. 9 studies with 707 people tested indirect contact with nature. Indirect contact was facilitated through videos (n=3), images (n=2), audio (n=1), or guided nature focussed imagery/meditation practices (n=3). Six of the studies involving direct contact were residential camps or experiences where people took part in a range of outdoor activities in a variety of settings. Ten involved walking in natural places such as forests, nature reserves, gardens, or urban nature. Two others involved running in a university sports field or visiting an animal park. Five studies invited people to carry out nature-based activities in their own time, with four studies asking people to engage with nature in particular ways (i.e., appreciating and noticing it) during their daily routine without asking them to spend more time outside.
  • Active or passive – There was a roughly even split between studies prompting active engagement (53%) (e.g. 30 Days Wild or our own 3 Good Things in Nature) or passive (47%) exposure to nature – although residential studies did not detail the type of engagement. Most indirect contact studies involved passive engagement, such as looking at photos or where nature featured as backgrounds to meditation or mindfulness training.
  • Repetition & time – Around a half of the studies used brief one-off periods of contact or engagement with nature, often twenty minutes or less. Others ranged from two to several hours. Short one-off activities included all indirect nature contact studies except for one. Six residential experiences lasted from 2 days to 1 month and involved a diverse range of nature engagement activities, including education, walking and meditation and mindfulness. Fourteen studies involved repeated (e.g. daily or weekly) nature contact or engagement, over periods ranging from 5 days to two months.
  • Sustained effects – Only fourteen of the 36 studies included follow-up measures which are essential to ascertain if interventions have a lasting, and therefore meaningful impact.

A note on environmental education: A recent meta-analysis found no significant effect of environmental education on nature connectedness.

Results

Importantly, the 12 studies with follow-up measures and involving 1259 participants showed a significant positive effect – showing sustained improvements in nature connectedness are possible. The human-nature relationship can be improved.

Lasting increases in nature connection were observed after regular nature activities and nature-noticing practices, as well as regular mindfulness and meditation practices carried out in real or simulated nature contexts. No differences were observed between different types of contact, quality of engagement. So, the results suggest a variety of forms of contact and engagement work.

Recommendations for practice

1 – Engage people with nature

The research shows that asking people to engage with nature increases feelings of nature connectedness. While further research to support development of interventions for lasting nature connection is needed, the evidence is already in place for real-world application.

2 – Encourage repeated nature engagement activities

There is little to no evidence to suggest that brief one-off activities have any impact on nature connection. Sustained increases in nature connectedness were observed when people were invited to engage with nature on a daily or more regular basis. While more research is needed to develop and test interventions for sustained nature connectedness, there is already sufficient evidence to support ongoing development of programmes and practices of regular nature engagement

3 – Create conditions for nature connection – scale-up!

The work shows that repeated engagement with nature brings sustained increases in nature connectedness, so use the pathways to nature connectedness to help design activities, programmes, places, spaces and systems to facilitate this. On a national and local scale this can be achieved through approaches to education, health, urban planning, transport and housing that recognise the value of accessible nature engagement to fix the broken relationship with nature.

Recommendations for research

  1. Examine the impacts of a wider range of nature engagement activities

While there is variety, such as walking in nature, meditation and mindfulness in natural settings, looking at nature images, appreciating nature, and sensory exploration of nature – additional research is needed to explore the impact of a wider range of activities designed to activate pathways to nature connectedness. For example, while many studies involve nature walks, there has been little exploration of the impact of sitting with nature or experimental studies of arts-based engagement with nature. Another area with surprisingly little research is the impact of taking part in citizen science activities.

  1. Identify factors that result in biggest and most sustained increases in nature connection

We made a distinction between passive and active engagement with nature to categorise the studies. There is a need for further research to examine this distinction more closely, and to develop understanding of the different types of active engagement with nature. Carefully designed studies that aim to identify, isolate and test ways of engaging with nature are vital for understanding the most effective pathways to nature connectedness, and the design of interventions. There are also many open questions as to the impact of other factors on nature connectedness, for instance, what is the effect of being with other people while undertaking nature connection activities? Does social engagement enhance or decrease the impact of nature contact? What is the relative impact of the quality of a space compared to people’s psychological engagement with nature in that space?

  1. Design and test practices for growing sustained nature connection

There is a lot of scope for development of additional activities that aim to activate pathways to lasting nature connectedness, and research exploring the feasibility and efficacy of these. Of key importance, however, is identification of factors that make an intervention appealing to people to try in the first place, and to maintain regular practice.

Conclusions

Targeting sustained improvements in nature connectedness can help address the global calls for a new relationship with nature required for a sustainable future. The analysis confirms that carefully designed interventions can deliver sustained increases in nature connectedness. Those sustained benefits can involve a variety of forms of engagement, but typically involve being prompted to engage with nature regularly. Although simple, this finding is important. We know many people do not ‘notice nature’ regularly and urban residents often spend only a few minutes in green spaces each day – even when they have good access. With global calls to fix the broken relationship with nature, simple and repeated engagement with nature can range from programmes focussed on individuals to creating the conditions for nature connectedness through considering the delivery of everything from education to health and macro factors such as the design of urban areas and land use.


Sheffield, D., C. W. Butler, and M. Richardson. 2022. “Improving Nature Connectedness in Adults: A Meta-Analysis, Review and Agenda” Sustainability 14, no. 19: 12494. https://doi.org/10.3390/su141912494

Posted in Uncategorized | Leave a comment

Me, myself and nature

The biodiversity stripes I shared recently have been very popular. This follow-up post shares another set of stripes that help show why the human-nature relationship has failed and biodiversity is falling.

First, a reminder that the biodiversity stripes were based on the the Living Planet Index which tells us that the population of mammals, birds, fish, amphibians and reptiles has seen an average drop of 68% globally since 1970. The global stripes start green in 1970 and turn grey as we enter the 2000s.

Global Bio Stripes – Data: Living Planet Index http://stats.livingplanetindex.org/

We know that at the personal level a close relationship with nature is built on five types of engagement with nature. From simply engaging with nature through noticing it, to a deep, emotional and meaningful relationship, where we celebrate and share how nature brings meaning to our lives. Here nature appears in what we write. So it follows that as nature, represented by biodiversity, declines, opportunities to engage with nature also decline and nature has less meaning in our lives. A situation shown by the frequency of nature words appearing in English. Shown below by stripes showing how the frequency of the word ‘nature’ in English has fallen since 1800.

Nature Usage Stripes: findingnature.org.uk – Data: Google Ngram Viewer: ‘[nature]’, 1800-2019 in English

In a deeper analysis of works of popular culture throughout the twentieth-century, Kesebir and Kesebir (2017) identified a cultural shift away from nature with a sharp decline in references to nature from the 1950s through to 2000. Noticeable dips in nature references occurred alongside the dawns of new technology (television in the 1950s and video games in the 1980s). The widespread use of smartphones may be another new dawn of further disconnection, potentially accelerated by uses such as ‘selfie-taking’ and social media which reflect and ultimately shape culture itself. Similarly, as references to nature have declined, individualistic words have increased in popular culture. So, while use of the word ‘nature’ has flatlined over the past century, use of the the word ‘me’ has quadrupled since 1990.

Usage of ‘nature’ and ‘me’ – Google Ngram Viewer: ‘[nature]’, ‘[Nature]’, ‘[NATURE]’, ‘[me]’, 1920-2019 in English.

Other researchers have noted how modern life is creating an epidemic of narcissism. People are becoming more self-centred and ‘collective narcissism’ forms too. As you might expect, narcissism is negatively related to a close relationship with nature and is seen as a major barrier to solving environmental problems. A powerful sense of self creates a world where the rest of life is peripheral. The fall in the rest of life (biodiversity) and rise in self-focus (use of me) over the last 50 years can be seen clearly below.

The decline of biodiversity and rise of ‘me’ since 1970. Data: Living Planet Index http://stats.livingplanetindex.org/Google Ngram Viewer: ‘[me]’, 1970-2016 in English.

This informal blog is reflected in our recent wider research. We’ve found that a closer relationship with nature, where the rest of life isn’t so peripheral, is related to opportunities to engage with nature – from biodiversity itself, to urbanisation and land use. And to consumption and technology –  income and smartphone ownership.

As biodiversity falls and becomes more distant, nature matters less. We celebrate and write about it less in a spiral of decline. Instead, it would seem we celebrate and write about ourselves. People need to feel part of something and worthwhile, but a close relationship with nature provides that too – explaining the feeling that one’s life is worthwhile four times more than socio-economic status. Nature’s recovery and biodiversity matters.


Posted in Uncategorized | Leave a comment

Biodiversity Stripes – A Journey from Green to Grey

Please note, the biodiversity stripes have been updated and now have a dedicated site at https://biodiversitystripes.info/  

The climate stripes were created by Professor Ed Hawkins at the University of Reading in 2018. A simple series of vertical coloured bars, showing the heating of the planet over 200 years. The stripes have had a huge impact. In the launch week, over a million people downloaded graphics from the website and they have appeared and been shared widely. The climate stripes have done a great job increasing awareness of climate change.

Global Climate Stripes, 1850-2021 data going from blue to red.Global Climate Stripes, 1850-2021. Data Source UK Met Office CC BY 4.0

Climate change has been found to get up to eight times more coverage than biodiversity loss. Yet only by addressing both the warming climate and loss of wildlife do we stand a chance of passing on a stable planet for future generations. This imbalance is odd as many of us claim to love nature and wildlife. And while we may talk about the weather, few of us love the climate. The decline of nature provides a sure sign that our relationship with nature is failing.

So, I’ve been hoping to see a biodiversity version of the stripes for a couple of years. After  only finding a pair of biodiversity striped socks online, and encouraged by Ed’s support, I set out to find some suitable historical data and create some biodiversity stripes.

I was well aware of the Living Planet Report which tells us that the population of mammals, birds, fish, amphibians and reptiles has seen an average drop of 68% globally since 1970, so it didn’t take me long to find the Living Planet Index. The global data includes over 20,000 populations of over 4000 species.

[Note: the 13/10/22 Living Planet Report 2022 update shows a 69% decline – two new grey stripes will be added to all images on the page]

Given it’s a single number representing many things over the whole globe, the stark decline since 1970 is quite smooth – which means ‘unstripey’ – the colour changes would be too subtle for stripes to emerge. So, to capture the trend while providing stripes I simply created a random point between the high and low confidence intervals for each year. As for the colours, the decline of wildlife is a loss of vibrancy and colour, the green becomes grey. So, the global stripes start green in 1970 and turn grey as we enter the 2000s.

Bio Stripes showing 1970 to 2016 data from Living Planet Index - higher biodiversity is green and grey is lower.

Global Bio Stripes 1970 to 2016 – Data: Living Planet Index http://stats.livingplanetindex.org/

I was also interested with wildlife that could be combined with the stripes. After considering caterpillars and worms while I walked the coast, I decided that the colourful natural world is represented nicely by the Toucan. Most of us have never seen a toucan in the wild, but we’re aware of them, their large vibrant beaks bringing colour to the world. To the Central and Southern Americas to be more precise. And here is a toucan representing the living planet index data for that region. This dataset includes 1,159 populations of 761 terrestrial and freshwater species.

Bio Stripes in Toucan bill showing 1970 to 2016 data from Living Planet Index - higher biodiversity is green and grey is lower.

Latin Bio Stripes – Data: Living Planet Index http://stats.livingplanetindex.org/

Closer to home, sadly, the UK is one of the most nature depleted counties on the planet, which turns our attention to human-nature connection and building a closer relationship with nature. With a paucity of nature comes a lack of nature connection, which is built upon simply noticing and engaging with nature. So little surprise that the UK is also bottom of a not so super European league for nature connectedness.  That recent research also shows a very strong association between biodiversity and nature connectedness. Add in research that shows that higher levels of nature connectedness brings better mental wellbeing and it is also people who become greyer without nature.

There is global recognition from organisations such as the UN and IPBES that the failing human relationship with nature is an underlying cause of the environmental crises. Greening the grey can rebuild the human-nature relationship, both through providing opportunities for people to take part in caring for nature, but also to enjoy a greener and more colourful world.

Hopefully, the bio stripes can go a little way to raising the awareness of the decline in wildlife. And readers of this blog can help. For example, with better image overlays or do you know of several decades of continuous data for the UK? This could be a broader representation or have a focus on certain species, from birds to insects. The stripes provide a great way to tell a story of that data, especially when combined with some images, for example showing the data for 944 freshwater species.

Bio Stripes showing 1970 to 2016 data from Living Planet Index - higher freshwater biodiversity is blue and grey is lower.

Freshwater Bio Stripes – Data: Living Planet Index http://stats.livingplanetindex.org/

Here, I’ve simply overlaid a declining flock of birds onto the global bio stripes.

Bio Stripes overlaid with birds showing 1970 to 2016 data from Living Planet Index - higher biodiversity is green and grey is lower.

Global Bio Stripes with birds – Data: Living Planet Index http://stats.livingplanetindex.org/

Climate change is structurally global, and biodiversity loss is global through aggregation across many habitats, species and populations. The effect of climate on local weather makes climate change visible and the costs more calculable. The loss of toucans and wildlife more generally, although sad, perhaps doesn’t present the same clear threat to human health for many. So, in addition to accurate and eye-catching information there’s a need to relate the loss of biodiversity to human well-being. Raising awareness that biodiversity underpins the health of the planet and that humans are part of the web of life. How wildlife helps keep us well, from pollinating crops to our microbiome of invisible friends essential for good health. Ultimately, when our world is grey, so are we.

When our world turns hot and grey, so do we. The heating of the planet and global loss of biodiversity since 1970 combined. Have a better overlay? Let me know. Global Bio Stripes – Data: Met Office and Living Planet Index http://stats.livingplanetindex.org/

Postscript:

The bio stripes have been really popular with engagement perhaps 100 times more than the pretty good engagement I usually get. There have been many positive comments, international engagement and interview requests – why wouldn’t there be given the original climate stripes have shown how effective the concept is? It’s interesting that the few negative comments have tended to come from those closer to the biodiversity data, I’m a psychologist. Biodiversity loss gets a lot less coverage than climate warming, the good news is that the stripes capture attention. They give a very general overview, but engaged a deeper story can be told.

Also to note, the biodiversity stripes weren’t created by a funded project with design expertise and extensive user testing. After some inspiration on a coastal walk, they were created at home one evening using Excel, copyright free clip art and PowerPoint, but I did use the Coblis colour blindness simulator to check the stripes still came through for those with colour vision deficiency. As in the original post, graphics from those with more design skills are welcome.


LPI 2022. Living Planet Index http://stats.livingplanetindex.org/. Downloaded 8 August 2022

Use of the biodiversity or nature stripes work must include appropriate acknowledgement of Miles Richardson and, when based on their data, LPI (LPI’s preferred format: LPI 2022. Living Planet Index database. 2022 www.livingplanetindex.org). Note that products derived from LPI data for financial gain are prohibited without written permission of ZSL and WWF.


Posted in Uncategorized | 9 Comments